Union Street Fire in Glasgow: Case Study
A retrospective on the Union Street fire, using the STILT/BEACO₂N network
- 7 min read
Union Street Fire in Glasgow: Case Study
STILT/BEACO₂N source attribution and transport evaluation, 8–11 March 2026
Overview
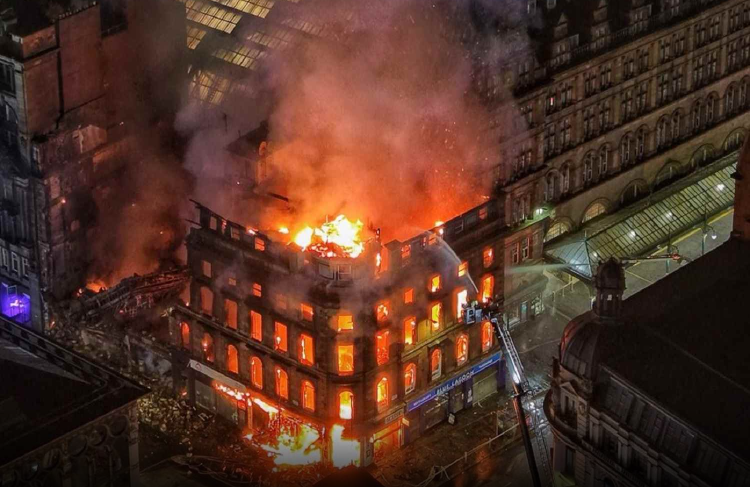
A fire was reported at approximately 15:40 UTC on 8 March 2026 at a vape shop located at 105 Union Street, Glasgow. The fire subsequently spread to the adjacent Union Corner building near Glasgow Central Station. Firefighting operations continued until 11 March.
The known location and approximate ignition time provide a useful case study for evaluating the BEACO₂N sensor network and WRF–STILT transport simulations.
Objectives
The analysis addressed the following questions:
- Did sensors with high modelled sensitivity to the fire location record an increase in PM2.5?
- Was the timing of the observed PM2.5 enhancement consistent with plume transport from the fire?
- Did the sensor response vary systematically with distance and direction from the source?
Results
STILT footprint
A time-integrated STILT footprint was calculated for the receptor and mapped across Glasgow. The grid cell with the largest cumulative footprint was located approximately 1 km west of the fire site. This pattern is consistent with enhanced modelled sensitivity in the direction associated with the prevailing wind during the event.
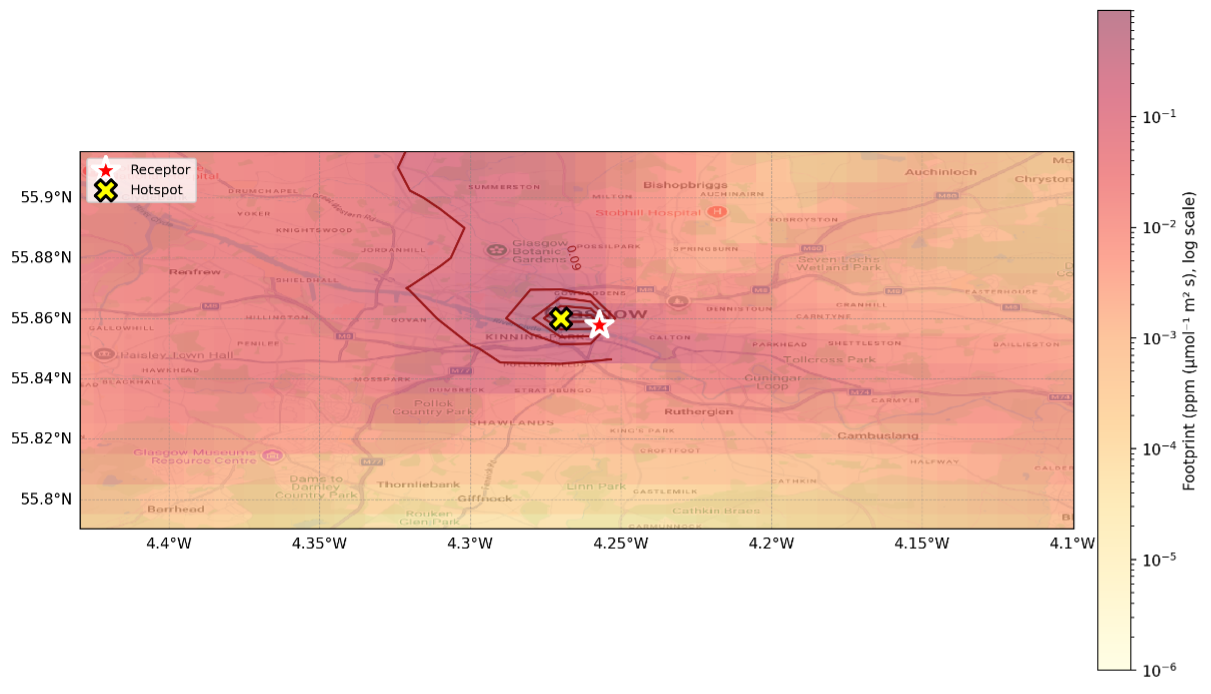
Figure 1. Time-integrated STILT footprint(Forward run) over Glasgow(with trajectory). The receptor location and maximum-sensitivity grid cell are indicated.
PM2.5 response
PM2.5 observations from six Glasgow BEACO₂N sites were examined. The sites were located between 0.7 and 6.4 km from the fire. Each site showed a period of enhanced PM2.5 during or following the fire period, in addition to the normal background variability.
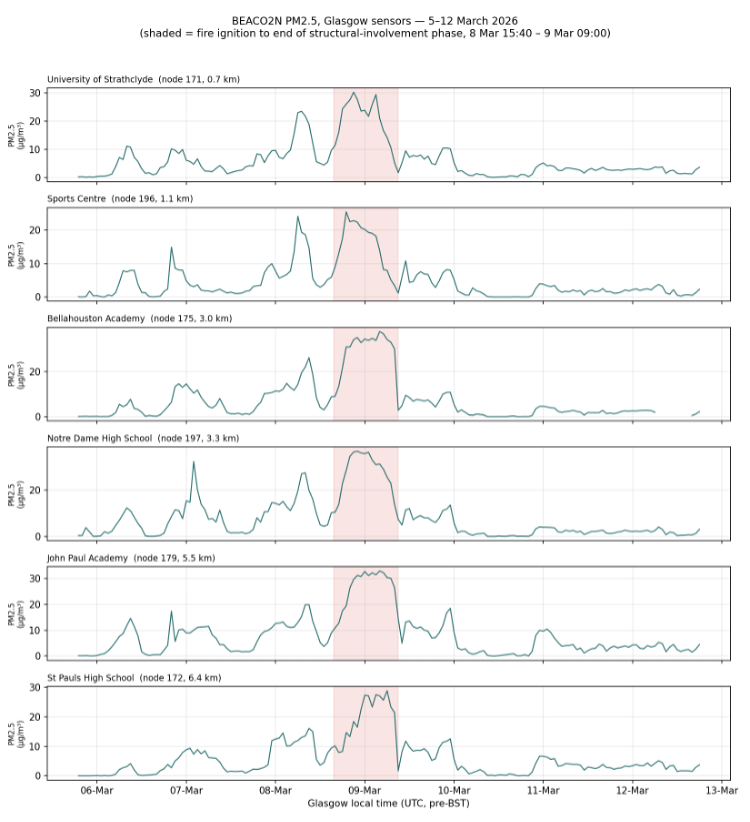
Figure 2. PM2.5 observations at six BEACO₂N sites between 5 and 12 March 2026. The shaded region represents the period from ignition to the end of the main structural-fire phase.
Peak concentration and distance
The maximum PM2.5 concentration did not decrease monotonically with distance from the fire. The largest peaks were measured at Bellahouston Academy and Notre Dame High School, located approximately 3.0 and 3.3 km from the source, respectively. These concentrations exceeded those measured at some sites closer to the fire.
This result shows that the plume was mainly transported along a specific corridor rather than spreading evenly in all directions
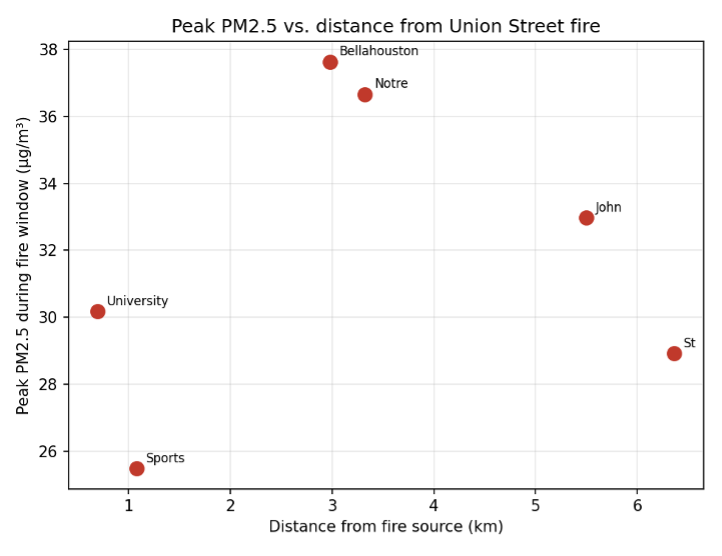
Figure 3. Maximum PM2.5 concentration during the fire period as a function of distance from the source.
Timing of the response
The time between the fire starting and the highest PM2.5 concentration generally increased with distance from the fire. However, these times represent delays in observing the peak concentration and should not be taken as the actual travel time of the plume.
The reported delays ranged from approximately 3.3 h at 1.1 km to 14.3 h at 6.4 km. These values are relatively long compared with the expected horizontal transport time over distances of 1–6 km under typical urban wind speeds. The delays may have been influenced by the continued emission of smoke throughout the fire, changes in wind speed and direction, boundary-layer evolution, atmospheric stability, plume accumulation and mixing, and local urban flow effects.
Consequently, a maximum PM2.5 concentration several hours after ignition does not necessarily indicate that the plume required several hours to travel from the source to the sensor. The maximum concentration may occur after the initial plume arrival because of continued emissions, changing meteorological conditions or gradual accumulation near the surface.
Bellahouston Academy and John Paul Academy showed similar delays of approximately 12.3 h, despite being located approximately 3.0 and 5.5 km from the fire, respectively. This departure from a simple distance–lag relationship indicates that distance alone does not explain the timing of the observed PM2.5 maxima. It may reflect changes in the transport pathway, wind direction or speed, boundary layer structure, or differences in the timing and persistence of fire emissions.
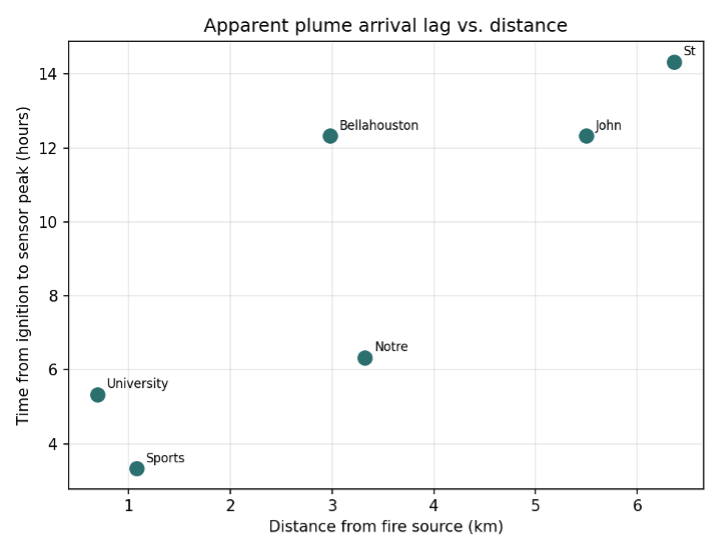
Figure 4. Time between ignition and the observed PM2.5 maximum as a function of distance from the fire. The lag represents the delay to the concentration maximum and should not be interpreted directly as the plume travel time.
Spatial distribution
The largest PM2.5 enhancements occurred at sites located northwest of the fire, particularly Bellahouston Academy and Notre Dame High School. Lower enhancements were observed at sites located east of the source, including the University of Strathclyde and Sports Centre.
The spatial distribution is consistent with directional plume transport and agrees qualitatively with the location of the maximum time-integrated STILT footprint.
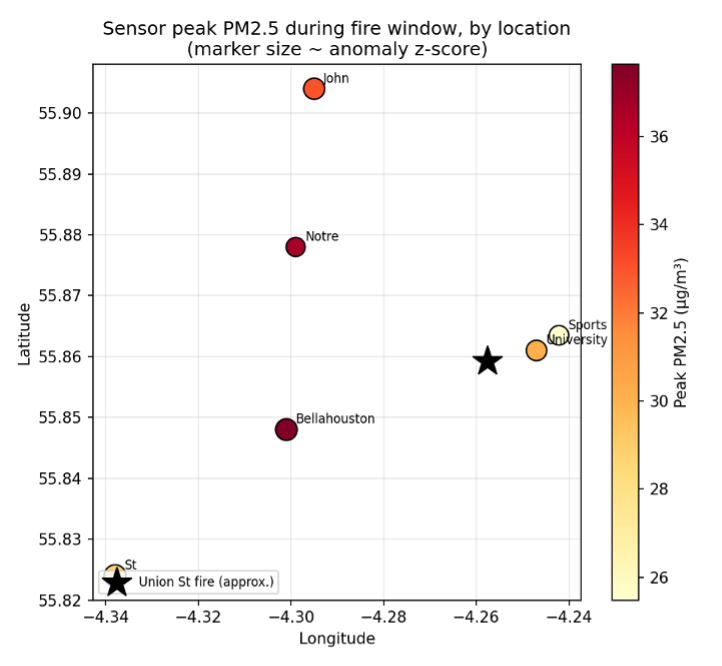
Figure 5. BEACO₂N sensor locations coloured according to the maximum PM2.5 concentration observed during the fire period.
Sensor response
Across the six monitoring sites, the baseline PM2.5 concentrations ranged from 4.6 to 8.1 µg m⁻³, while the fire-period maxima ranged from 25.5 to 37.6 µg m⁻³. The largest increases were observed at Bellahouston Academy and Notre Dame High School, which were located northwest of the fire. The closest sites, University of Strathclyde and Sports Centre, recorded lower maximum concentrations despite their shorter distances from the source. Peak z-scores ranged from 4.0 to 5.2, indicating that the observed enhancements were substantially above the local background variability. The delays from ignition to the concentration maxima ranged from approximately 3.3 to 14.3 h and did not follow a strictly monotonic relationship with distance.
Interpretation
All six sites recorded enhanced PM2.5 during the study period. Therefore, the presence or absence of a response does not by itself distinguish the sites affected by the fire. The magnitude and timing of the enhancement provide more useful indicators of plume influence.
The general increase in the delay between ignition and the PM2.5 maximum with distance is consistent with a source-related influence, but it should not be interpreted as evidence of a simple outward-moving plume with a single travel time. The measured maximum at a receptor depends on both transport and the temporal evolution of the source.
The stronger response at northwestern sites, compared with sites at similar or shorter distances to the east, supports the interpretation of a directional plume. This pattern is also consistent with the location of the maximum time-integrated STILT footprint.
The observed timing should be assessed using the time-resolved meteorological fields and WRF–STILT trajectories. In particular, the analysis should distinguish between the time of first plume arrival, the onset of sustained enhancement and the time of maximum PM2.5 concentration. These three quantities need not coincide.
Limitations
- The analysis is based on six sensors, which limits the strength of the inferred distance–response and distance–delay relationships.
- PM2.5 enhancements may also have been influenced by other activities during the same period.
- No independent estimate of the fire emission rate or plume injection height was available.
- The STILT simulations do not resolve building-scale flow within the street canyon surrounding Glasgow Central Station. Local channelling, recirculation and wake effects may therefore not be fully represented.
- The use of the concentration maximum as the timing metric may exaggerate the apparent transport delay because the maximum can occur after the initial arrival of the plume.
- Further comparison with the modelled wind field, boundary-layer height and forward or backward trajectories is required to determine the physical transport times more reliably.
Conclusions
The Union Street fire provides an observational case study for evaluating the combined STILT and BEACO₂N framework. All six sensors recorded enhanced PM2.5 during the fire period, while the spatial distribution of the response was broadly consistent with directional transport away from the source.
The strongest responses occurred northwest of the fire, in agreement with the location of the maximum time-integrated STILT footprint. The delay between ignition and the observed PM2.5 maximum generally increased with distance, but the reported delays should be interpreted as response delays rather than direct plume travel times.
The relatively long delays, including values of approximately 12–14 h, may be explained by the duration of the fire, changing meteorological conditions, boundary-layer evolution, plume accumulation and local urban flow effects. The similar delays observed at Bellahouston Academy and John Paul Academy, despite their different distances from the source, further demonstrate that distance alone does not control the timing of the concentration maximum.